The 4 Types of Distortion a Good Digital Room Correction System Should Address

The two weakest components of a HiFi system are typically the loudspeaker and the room the music is playing in— the second of which is most often overlooked. Even if you’ve invested in a best-in-class HiFi system, the listening room can still have a tremendous effect on the overall sound experience. Both a sound system’s frequency response* and impulse response** are profoundly altered by everything from standing wave patterns to wall reflections.
The good news is the technology exists to help address such weaknesses. If you’re ready to venture into the possibilities of digital room correction, here’s a primer to help you get your bearings.
The mission of a digital room correction system is to tune a loudspeaker to the room it’s playing in. Of course it isn’t really “correcting” the room, just adapting the signal sent to the speaker in order to pre-compensate for unwanted coloration of the sound experience. A room correction system also aims to optimize the loudspeaker itself. It does this by “seeing” through the lens of one or several microphones, and then tuning the sound of the combined electroacoustic system.
There are four main types of distortion a good digital room correction should address:
1. Room Resonances/Standing Waves
Low frequencies, large wavelength, late sound, all directions.
Most room correction systems primarily address room resonances/standing waves that show up at certain frequencies determined by your room layout and dimensions. As you can see in the power response graph below, the variations between different measurement positions are not significant up to a certain frequency. In this particular room, you see variations starting at roughly 100 Hz, which is not uncommon. If you want to reduce room resonances at a few hundred Hz however, you’ll need to take measurements across a few microphone positions to make sure you are doing a robust compensation. Room resonances and standing waves primarily affect the bass performance. You will hear that certain notes are severely pronounced and sound boomy due to the geometry of the room. Room correction systems need to be careful in compensating for nulls or suck-outs. If there is a signal cancellation, no amount of energy boost will compensate for that.
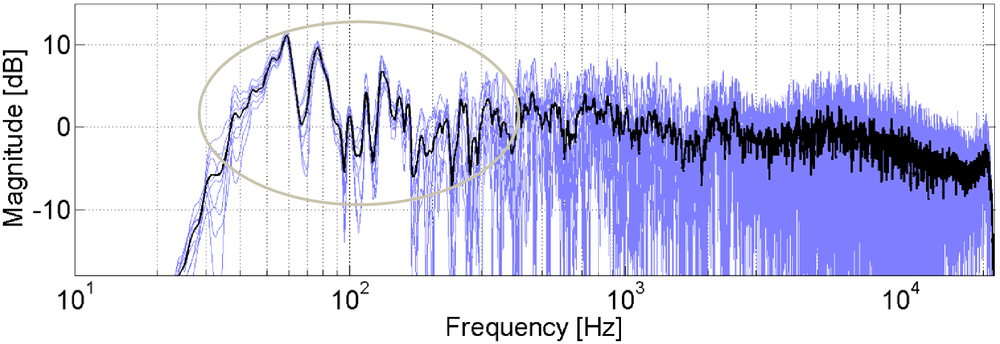
The power response in nine different positions around the room. The marked area represents room resonances/standing waves. The blue lines show individual measurement results, and the black line shows the average power response.
2. Misalignment of Drivers
Mid to high frequencies, direct sound, same direction as speaker.
The impulse response of a HiFi system (including the room) consists of direct waves, early reflections, and late reflections. It’s in the direct wave that you will spot any misalignment of drivers. In the impulse response plot below, which shows a two-way speaker, you can see that the sound from the tweeter arrives at the listening position earlier than the sound from the woofer (see the “bump” just after the main impulse of the direct wave). Issues in the direct wave are due to the loudspeaker itself.
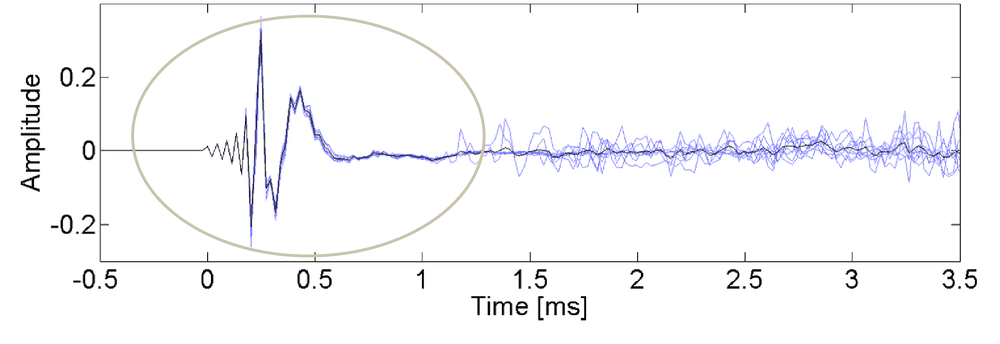
The impulse response in nine different positions around the room. The marked area represents the misalignment of drivers. The blue lines show individual measurement results, and the black line shows the average impulse response. The impulse response measurements have been aligned in time for easier identification of the common behavior.
3. Early Reflections/Cabinet Diffraction
Mid to high frequencies, early sound, same direction as speaker.
Early reflections and cabinet diffraction, appearing within a narrow angle around the speakers, smear the sound image and cause a perceived change of location of instruments and voices. As a result, it becomes harder to pinpoint each instrument in a mix, the position of the voice becomes imprecise, etc. It also affects overall clarity and voice intelligibility. The direct wave and the early reflections need to be dealt with more carefully than standing waves. The issues here are wideband and affect higher frequencies, which means that the timing and positions for which you optimize in become important.
The impulse response in nine different positions around the room (same graph as previous one). The marked area represents early reflections/cabinet diffraction. The blue lines show individual measurement results, and the black line shows the average impulse response. The impulse response measurements have been aligned in time for easier identification of the common behavior.
4. Late Reflections/Room Reverberation
Mid to high frequencies, late sound, all directions.
Late reflections and room reverberation add a certain color (spectral change) and spaciousness to the sound. However, in normal listening rooms, where the amount of late reflections is not extreme, they don’t have a strong impact on the sound experience. In essence, what you want to do here is to make sure that the overall spectral effect is smooth and the reflections are not adding any significant deviations from a smooth target curve. The room correction system should just make sure that the stationary frequency response is smooth.

The impulse response in nine different positions around the room (same graph as previous one but with less zoom). The marked area represents late reflections/room reverberation. The blue lines show individual measurement results, and the black line shows the average impulse response. The impulse response measurements have been aligned in time for easier identification of the common behavior.
This was just a brief introduction to digital room correction and the types of distortion a good system should address. The real test, of course, is to actually experience the results first hand. I recommend downloading a free trial of the Dirac Live Room Correction Suite and giving it a go in your own HiFi system.
– Mathias Johansson, CEO at Dirac Research
Terminology Explained:
*The frequency response of a system describes the deviations in dB (as well as in phase) from the original source as a function of frequency. In essence, it describes in detail how each note gets attenuated or boosted by the HiFi system (the amplitude or power response), and also how each note gets shifted slightly differently in time compared to the other notes (the phase response). Together, the power response and the phase response make up the frequency response.
**The impulse response is the inverse Fourier transform of the frequency response. It shows how a system is able to reproduce transients such as drumbeats, claps, and strokes on the guitar, etc.