How to Obtain a Good Stereo Sound Stage in Cars
Designing a sound system for a car has a different success formula than designing a sound system for a living room. In a car, neither the loudspeakers or the people listening to them can be placed precisely according to the standard. Consequently, when listening to a recording, the stereo information is likely to be lost or, at least, severely distorted.
Here we will discuss the motivation and basic principles behind a Dirac technology called Dirac Virtual Center, which was developed to solve one of the classic challenges in automotive sound system tuning: the near-side bias problem.
First we will take a look at the basic theory, along with a classical solution known from audio literature. We will then explore some practical limitations of the classical approach, and give an outline of what Dirac Virtual Center can do to make things work better.
Stereo reproduction and the near-side bias problem
For a stereo recording to be perceived as intended, it needs to be played back over a sound system that correctly reproduces the spatial information encoded in the stereo signal. In short, stereo recordings rely on a psychoacoustic principle called summing localization. This means that, when superimposed at the entrance of our ear canals, sound emitted by two loudspeakers can be perceived as coming from points in space where no actual sound source is located (so-called phantom sources). In particular, a mono signal which is equal in the left and right loudspeaker channels will be perceived as coming from a point in the center, directly in front of the listener. This is often referred to as the phantom center effect.
In order for summing localization to work properly, it is required that the listener is located somewhere along a center axis between two identical loudspeakers with equal distance to both, as shown in Fig. 1. This requirement poses a problem in automotive sound system design since, in a car, neither the listeners or the loudspeakers can be placed exactly as dictated by the standard. Consequently, when a recording is listened to in a car, the stereo information will be lost or, at least, severely distorted.

Figure 1: A listener located along a center axis between two identical loudspeakers with equal distance to both.
For example, if a listener sits closer to left loudspeaker, the sound from the left loudspeaker will arrive at the listener slightly before the sound from the right loudspeaker. The resulting time difference between the left and right loudspeakers causes the perceived direction of sound to be heavily biased towards the left loudspeaker (see Fig. 2). Consequently, the mono component of the stereo signal will not be perceived as coming from straight in front of the listener, but almost solely from the left speaker. This collapse of the stereo panorama into the loudspeaker closest to the listener is often referred to as near-side bias.
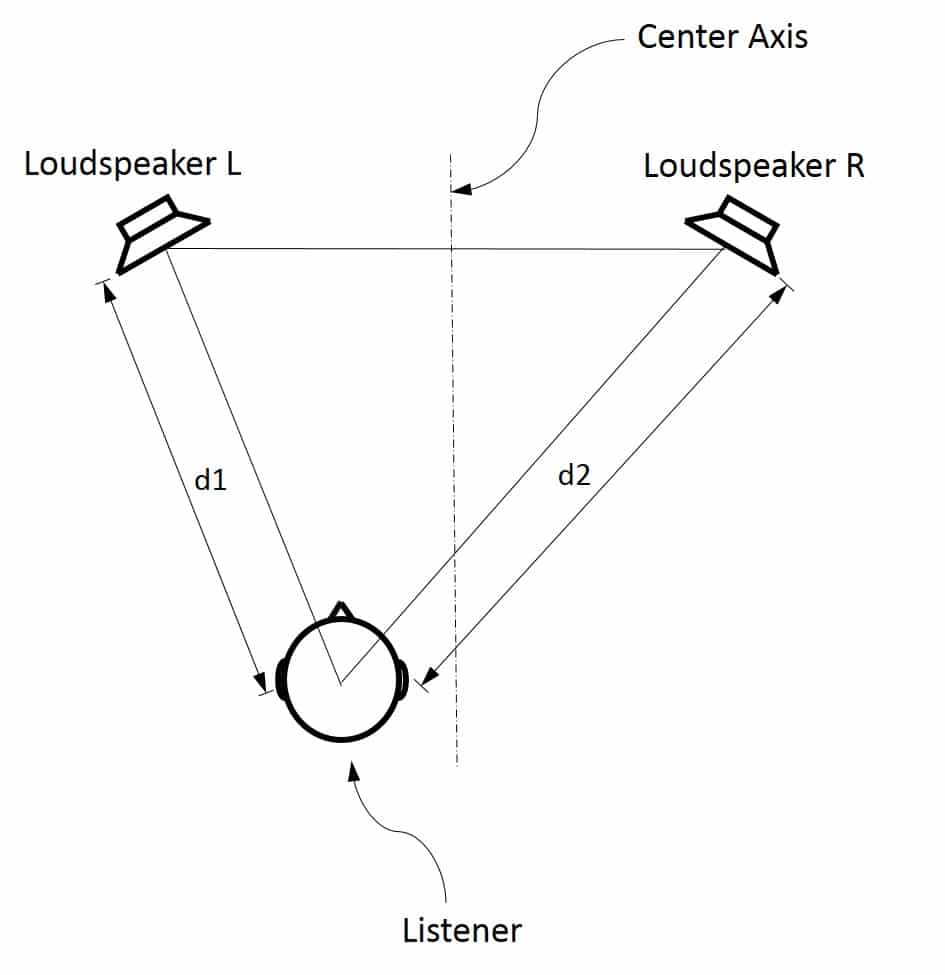
Figure 2: A listener sitting closer to the left loudspeaker, resulting in the sound from the left loudspeaker arriving at the listener slightly before the sound from the right loudspeaker.
In an automobile, the listener is sitting either to the left or the right of the center axis. A simplified view of this case is shown in Fig. 3, where Listener 1 sits closer to the left loudspeaker, and Listener 2 sits closer to the right loudspeaker. In this example, a sound intended to be reproduced as coming from a point straight ahead of the listener will be experienced by Listener 1 as coming from the left side, and by Listener 2 as coming from the right side.

Figure 3: Two listeners in an automobile, sitting to the left and the right of the center axis.
In the case of a single listener located off from the center axis, the near-side bias problem can be solved by simply adding a delay to the signal path of the loudspeaker closest to the listener, so that the left and right signals arrive at the listener with equal delay.
However, whenever there are two or more listeners, and the listeners are spread out relative to the center axis, adding a delay to one channel cannot solve the near-side bias problem for all listeners simultaneously. For example, if listeners are located according to Fig. 3, then adding a delay in the left channel may solve the near-side bias problem for the left listener. However, the right listener will then experience an even worse bias to the right side. Thus, it seems that the near-side bias problem has no solution in a multiple-listener scenario; that true stereo reproduction can be delivered, at most, to one listener at a time. Fortunately, it turns out that this is not true: A quite effective solution can actually be found, at least in theory, if we look at the problem in the frequency domain.
Delay difference along the frequency axis: The IDP
How does a delay between two signals manifest itself along the frequency axis? The delay difference between two channels of an audio system, experienced at a spatial position, can be described in the frequency domain by a phase difference function which is called the inter-loudspeaker differential phase (IDP), taking values between -180 and +180 degrees. An example of an IDP is shown in Fig. 4. The black line represents the IDP of a constant time delay that results in a position where the listener is 35.6 cm closer to the left loudspeaker than the right loudspeaker. A sound wave from the right loudspeaker then arrives with a delay of 1.035 milliseconds, compared to if the same sound wave were emitted from the left loudspeaker.
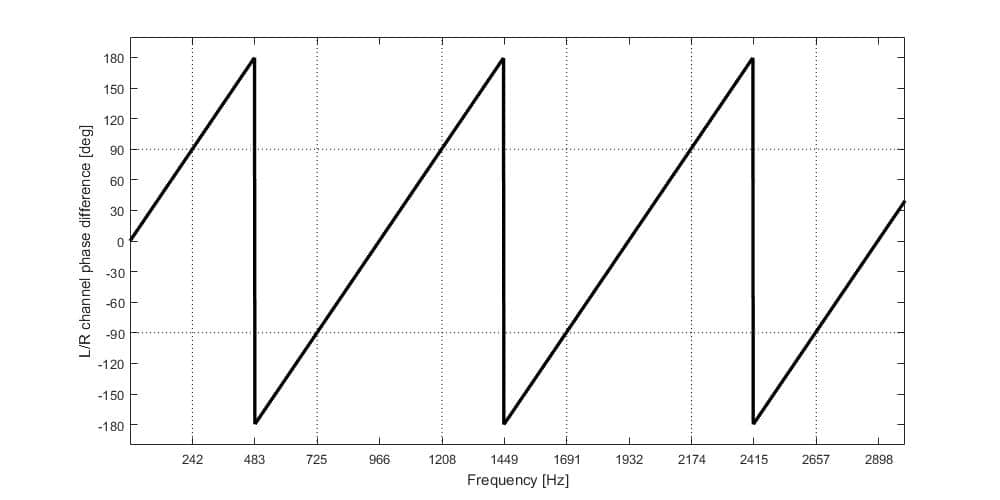
Figure 4: An example of Inter-loudspeaker Differential Phase (IDP).
In order to understand why the IDP in Fig. 4 looks as it does, one needs to understand the concepts of phase and frequency, as explained by the following argument:
At a single frequency, sound is by definition a sine wave and its location in time is determined by the phase lag in degrees, where 360 degrees corresponds to one full cycle of the wave. In Fig. 5, the thick blue curve illustrates a 440 Hz sine wave. The red curve has zero-degree phase lag relative to the blue curve (although its amplitude is half of that of the blue curve). The red and blue curves are therefore said to be in-phase. The green curve (which has the same amplitude as the blue) has a 180-degree phase lag relative to the blue curve, which also means they are the exact opposites of one another and are said to be out-of-phase. Finally, the black curve in Fig. 5 has a phase lag of 90 degrees, which is exactly between the phase lags of the red and green curves. It is thus neither fully in-phase or fully out-of-phase with the blue curve. Two sine waves can be said to be either predominantly in-phase or predominantly out-of-phase, if their relative phase lag is either within or outside the +/- 90 degree interval.
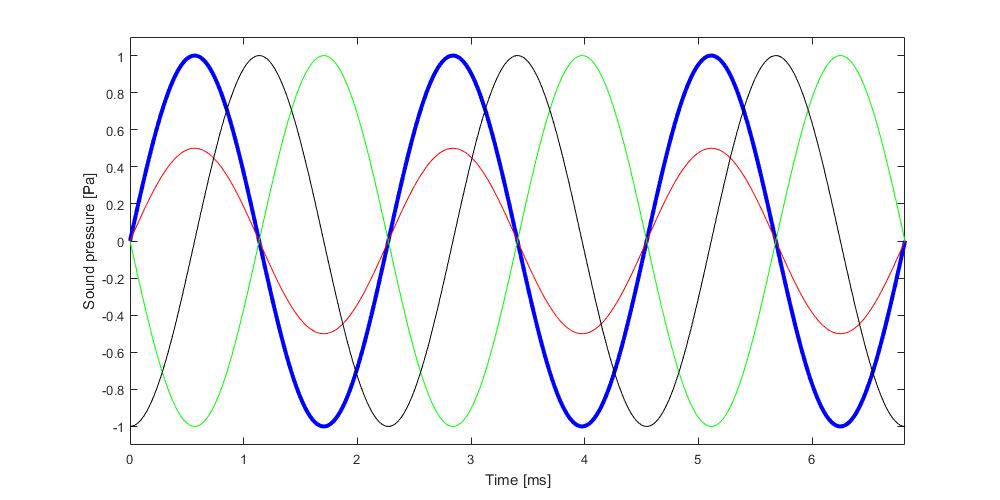
Figure 5: Illustration of phase lag: The red, black and green curves have phase lags of 0, 90 and 180 degrees, respectively, relative to the blue curve.
The frequency of a sinusoidal wave is the number of completed cycles per second, and for a 440 Hz sine wave it takes 1/440 s = 2.3 ms to complete one full cycle. A time delay of 2.3 ms is therefore equal to a phase lag of 360 degrees at 440 Hz. At 880 Hz, however, a 2.3 ms delay corresponds to two full cycles which implies a phase lag of 720 degrees. By the same argument, a 2.3 ms delay is equal to a phase lag of only 180 degrees if the frequency is 220 Hz.
Thus, a constant time delay corresponds to a phase lag that is linearly proportional to frequency. Moreover, since a phase lag of 181 degrees is indistinguishable from a phase lag of 179 degrees, it can always be specified as a value between 180 and +180 degrees. A linearly increasing phase lag therefore contains “jumps” of 360 degrees with regular intervals.
The above argument explains the behavior of the IDP in Fig. 4: The constant delay of 1.035 ms between the left and right channels corresponds to an IDP that increases linearly with frequency, and every time it reaches +180 degrees it jumps down to -180 degrees.
Would you like to keep reading?
Download your free copy of the full white paper below. Part 2 of How to Obtain a Good Stereo Sound Stage in Cars takes a closer look at inter-loudspeaker differential phase (IDP) in the automobile context, investigates the drawbacks of the classical solution to the near-side bias problem, and introduces Dirac Virtual Center.
Author: Lars-Johan Brännmark, Chief Scientist at Dirac Research